Digital Soil Maps Help Track Carbon in Farmland

Jenn Hoskins
5th September, 2025

Digital Soil Maps Help Track Carbon in Farmland

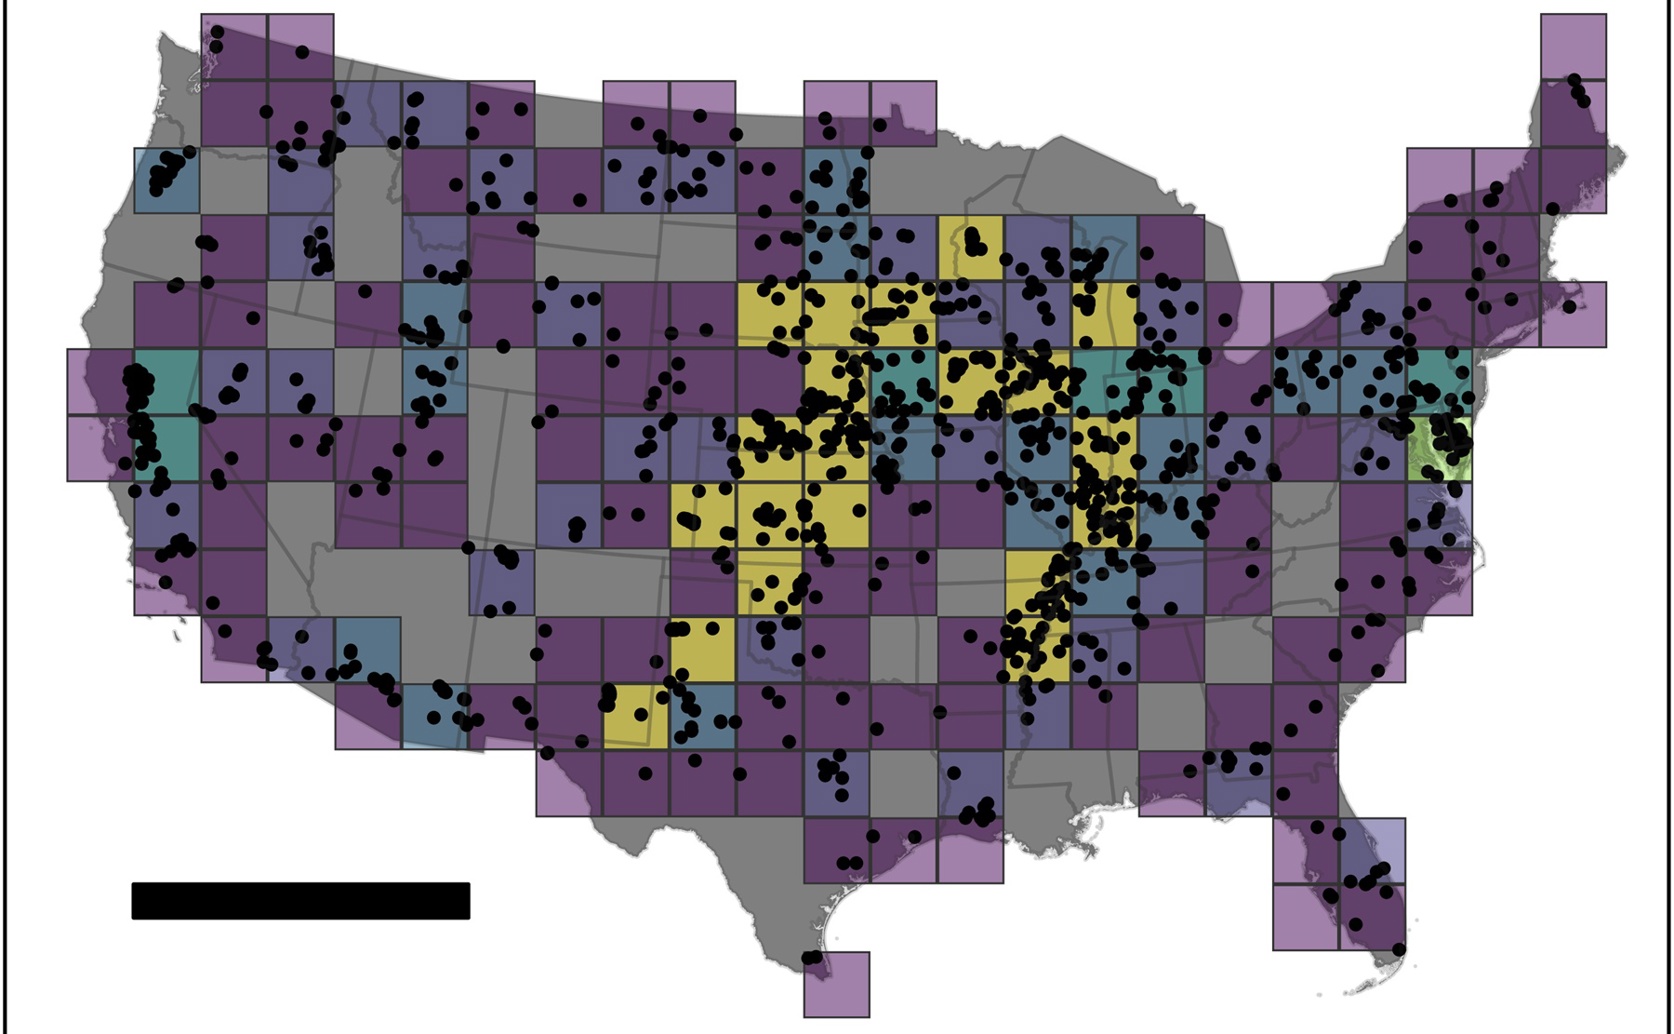
The spatial distribution of 5,230 in-situ soil samples across 47 states demonstrates the geographically representative coverage of active row-crop agriculture that enabled the ATLAS-SOC framework to accurately predict soil organic carbon content in support of voluntary carbon markets.

Image adapted from: Kellner et al. / CC BY (Source)

Key Findings

  • A new machine learning model, ATLAS-SOC, accurately predicts soil organic carbon (SOC) levels across agricultural land in the contiguous United States
  • This model excels at predicting SOC because it focuses specifically on agricultural soils and uses recent data, unlike existing maps which often underestimate or overestimate levels
  • Time-series data from Sentinel-2 satellites, tracking vegetation changes, was the most important factor in accurately predicting SOC content, highlighting the value of monitoring land use
The increasing need to mitigate climate change has led to growing interest in ‘voluntary carbon markets’ (VCMs), where businesses and individuals can invest in projects that reduce greenhouse gas emissions. A key area for carbon sequestration – removing carbon dioxide from the atmosphere – is agricultural soil. Healthy soils can store significant amounts of carbon, but accurately measuring this stored carbon, known as soil organic carbon (SOC), has been a major hurdle to the widespread adoption of VCMs in agriculture. Traditional methods are often slow, expensive, and difficult to implement across large areas[2]. This creates uncertainty for investors and hinders the growth of these vital markets. Researchers at Perennial Climate Inc.[1] have addressed this challenge by developing a new digital soil mapping (DSM) framework to predict SOC content in agricultural soils across the contiguous United States (CONUS). This framework leverages machine learning algorithms and a vast array of spatial data, including historical climate information, current weather patterns, topographical features, soil characteristics, and data collected over time from remote sensing technologies. The study focused on 5,230 measurements of SOC taken from agricultural land in 47 states. The core of the approach is to build a predictive model that relates SOC levels to various environmental factors. Unlike previous attempts, this model was specifically trained on agricultural land data, recognizing the unique characteristics of farmed soils. The machine learning algorithms identified the most important factors influencing SOC content. The results were highly promising, with the model closely matching independent measurements of SOC taken in the field. Statistical analysis showed a strong correlation between predicted and measured values (R2 = 0.811), indicating a high degree of accuracy. The root mean squared error (RMSE) of 0.041 further confirms the model's precision. To demonstrate the improvement over existing methods, the researchers compared their model’s predictions to four publicly available SOC data products. These comparisons revealed significant discrepancies, highlighting the limitations of generalized soil maps when applied to agricultural settings. The existing products consistently underestimated SOC at lower levels and overestimated it at higher levels, or showed consistent underestimation across all values. This suggests that these existing maps are not sensitive enough to capture the nuances of SOC variation in agricultural landscapes.[2] highlighted the need for credible and reliable measurement platforms, and this study demonstrates a potential solution to that issue. A key finding was the importance of time-series data from the Sentinel-2 satellite. These images, which capture changes in vegetation and land surface over time, proved to be the strongest predictors of SOC content. Temperature variables and features related to surface hydrology – how water moves across the landscape – were also identified as important factors. This underscores the value of incorporating recent, geographically representative data into SOC quantification efforts. The study showed that careful selection and processing of input data, known as ‘feature engineering,’ can significantly enhance the sensitivity of SOC measurements to optical remote sensing data. The research builds upon earlier work recognizing the potential of soils to mitigate greenhouse gas emissions[2], and the challenges associated with quantifying these effects. The development of SoilGrids, a global soil prediction system, represents a significant step forward in soil mapping[3]. However, SoilGrids, while providing valuable baseline information, doesn’t focus specifically on agricultural land and may lack the precision required for VCM applications. The Perennial Climate Inc. model complements SoilGrids by providing a more targeted and accurate assessment of SOC content in agricultural soils, utilizing machine learning and high-resolution remote sensing data to overcome the limitations of previous approaches. The need for repeat soil surveys and long-term experiments to validate SOC change, as discussed in[4], is also addressed through the use of independent field measurements in the model’s development and validation.

AgricultureEnvironmentSustainability

References

Main Study

1) Digital soil mapping in support of voluntary carbon market programs in agricultural land

Published 2nd September, 2025

https://doi.org/10.1371/journal.pone.0327895


Related Studies


3) SoilGrids250m: Global gridded soil information based on machine learning.

https://doi.org/10.1371/journal.pone.0169748


4) How to measure, report and verify soil carbon change to realize the potential of soil carbon sequestration for atmospheric greenhouse gas removal.

https://doi.org/10.1111/gcb.14815


Related Articles

An unhandled error has occurred. Reload 🗙