Mapping Europe's Nature Community Online

Jenn Hoskins
14th August, 2025

Mapping Europe's Nature Community Online

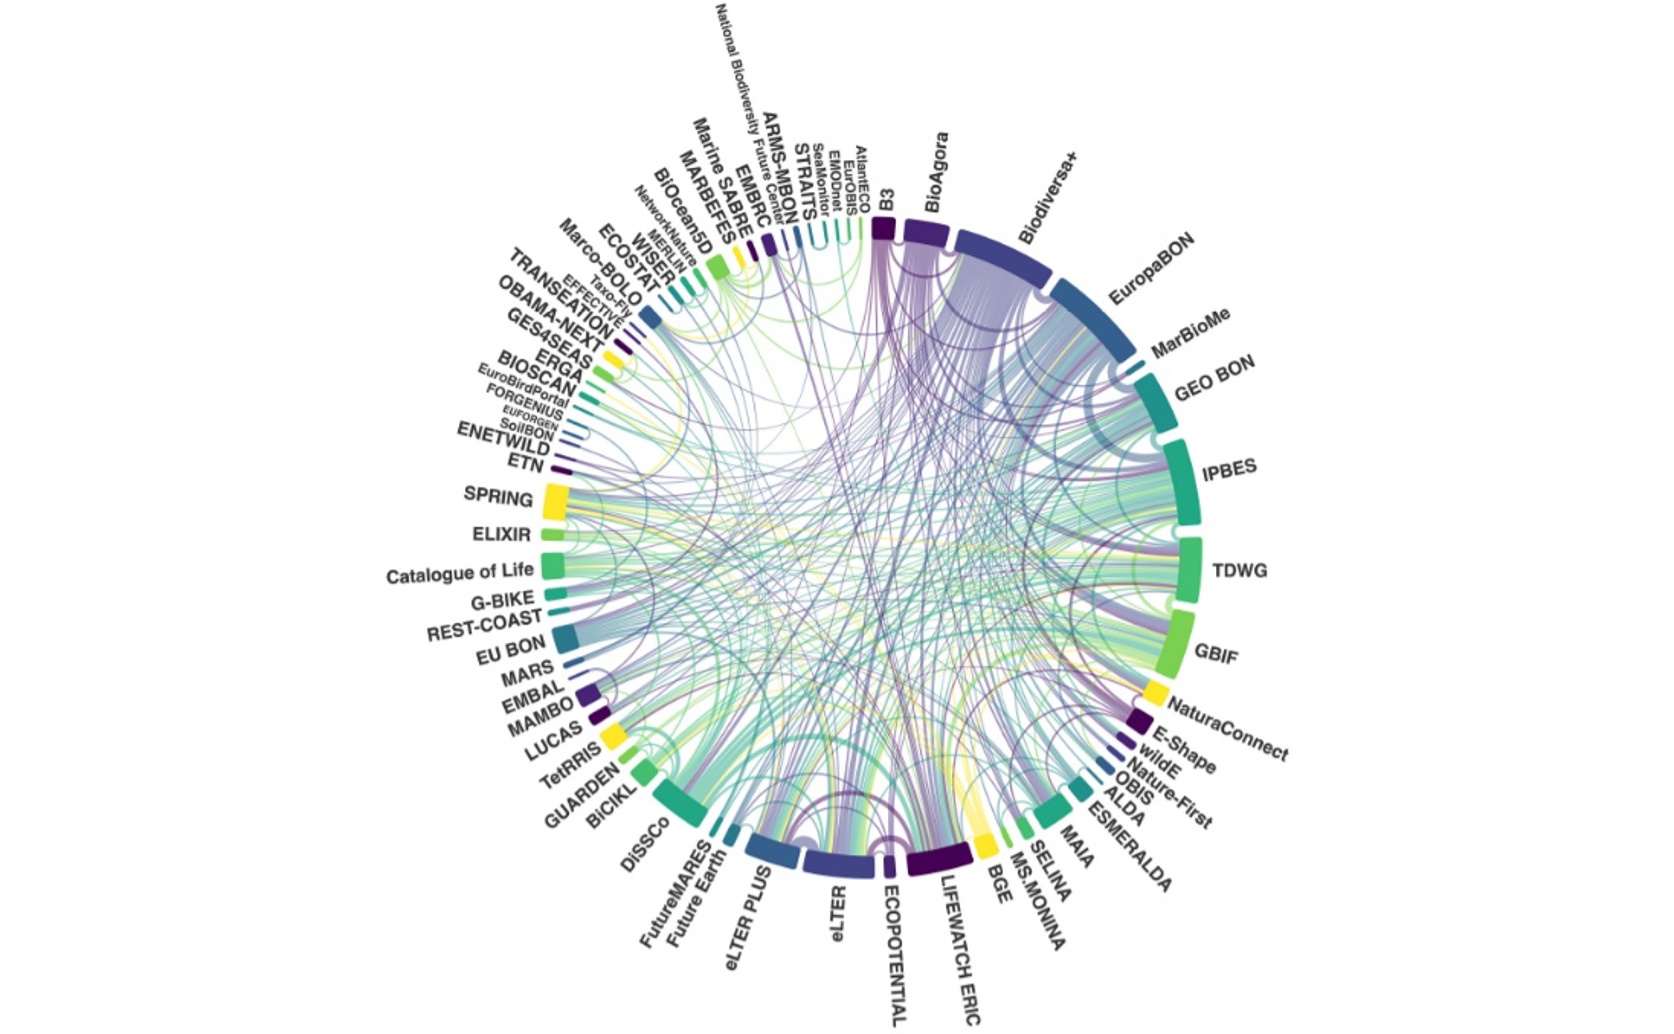
Network analysis identifies LifeWatch ERIC, EuropaBON, eLTER, DiSSCo, and Biodiversa+ as the most highly connected EU projects and infrastructures, underscoring their critical function as central hubs for coordination and data exchange within the biodiversity monitoring community.

Image adapted from: Langer et al. / CC BY (Source)

Key Findings

  • In Europe, biodiversity monitoring is fragmented, making it difficult to track changes and inform conservation efforts effectively
  • Researchers developed the EuropaBON Stakeholder Dashboard, an interactive tool mapping Europe's biodiversity monitoring network to show who is involved and their connections
  • The dashboard reveals a well-connected network, yet highlights critical gaps in Eastern European, marine, and freshwater participation, essential for comprehensive conservation
Europe's rich biodiversity faces increasing threats from climate change, pollution, and habitat destruction. Effectively addressing these challenges requires robust monitoring systems to track changes and inform conservation efforts. However, current biodiversity monitoring across Europe is often fragmented, with data collected by various groups and stored in disparate locations. This makes it difficult to get a comprehensive picture of biodiversity status and trends, hindering effective policy responses. The challenge lies in bringing together this scattered knowledge and coordinating the many organizations and individuals involved in collecting and using biodiversity data. To tackle this, researchers at Universität für Bodenkultur Wien have developed the EuropaBON Stakeholder Dashboard[1]. This innovative tool is a dynamic, interactive web application designed to map and visualize the structure of Europe's biodiversity monitoring community in real-time. It aims to provide a clear overview of who is involved, where collaborations exist, and where further engagement is needed across the continent. The development of such a system builds upon earlier efforts to standardize and integrate biodiversity data. For instance, the concept of Essential Biodiversity Variables (EBVs) was introduced to create a minimum set of critical variables needed to study and manage biodiversity change globally[2]. This initiative highlighted the immense complexity of integrating diverse data sources—from incidental observations to standardized surveys and population time series—across different species, locations, and timeframes. Key challenges identified included correcting biases, harmonizing data units, dealing with varying spatial resolutions, and ensuring data quality and interoperability. The EuropaBON Stakeholder Dashboard directly addresses the need for better coordination and transparency among data providers and users, which is a crucial first step in overcoming these 'Big Data' challenges for EBVs. The earlier work outlined 11 workflow steps for operationalizing EBV data products, emphasizing the need for clear, findable, and accessible metadata, as well as addressing technical, semantic, and legal interoperability[2]. The dashboard contributes to this by making the "who" and "where" of data collection and use more transparent. The EuropaBON Stakeholder Dashboard allows users to explore connections within the network across three main dimensions: the type of organization (occupational sector), the environment they focus on (terrestrial, freshwater, or marine), and their geographic region. It displays detailed network graphs, an interactive map, and summary statistics. Users can see whether institutions primarily provide data, use data, or do both, and assess their level of participation in EuropaBON activities. The dashboard also highlights connections to key European Union projects and existing research infrastructures. This level of detail helps identify the most central and active institutions within the network, and crucially, reveals gaps in coverage across different thematic areas and regions. A core principle underpinning such data initiatives is the FAIR Data Principles[3]. These principles advocate for data to be Findable, Accessible, Interoperable, and Reusable, with a strong emphasis on making data usable by machines as well as humans. While the EuropaBON dashboard doesn't directly make biodiversity data FAIR, it enhances the findability and accessibility of information about the data ecosystem itself. By mapping who holds what data and their connections, it facilitates the subsequent steps required to make the actual biodiversity data FAIR. This move towards greater transparency and structured information about data flows is essential for improving the reuse of scholarly data, as advocated by the FAIR principles. The approach taken by EuropaBON also echoes successful national-level initiatives. For example, BioModelos in Colombia[4] demonstrated how an online system supported by a core team and a network of experts could operationalize an essential biodiversity variable, specifically species distribution. BioModelos allowed experts to assess data quality, identify environmental variables, and validate distribution models, making validated models freely available. EuropaBON scales this concept to a European level, creating a comprehensive network and a tool to manage and visualize the participation of hundreds of stakeholders. This shows a clear progression from national efforts to a coordinated, continental approach, enhancing the value of open access species data by making the network behind its collection and use more visible and efficient. By combining technological integration with active stakeholder participation, the EuropaBON Stakeholder Dashboard enhances transparency and promotes inclusivity. It provides both researchers and policymakers with an up-to-date overview of the complex landscape of biodiversity monitoring in Europe, fostering a more coordinated and effective approach to conservation.

EnvironmentSustainabilityEcology

References

Main Study

1) The EuropaBON Stakeholder Dashboard: A dynamic web application to map Europe’s biodiversity community

Published 13th August, 2025

https://doi.org/10.1371/journal.pone.0329390


Related Studies

2) Building essential biodiversity variables (EBVs) of species distribution and abundance at a global scale.

https://doi.org/10.1111/brv.12359


3) The FAIR Guiding Principles for scientific data management and stewardship.

https://doi.org/10.1038/sdata.2016.18


4) BioModelos: A collaborative online system to map species distributions.

https://doi.org/10.1371/journal.pone.0214522


Related Articles

An unhandled error has occurred. Reload 🗙