Guides Improve Accuracy in Judging Pecan Leaf Disease Severity

Phil Stevens
27th January, 2024

Guides Improve Accuracy in Judging Pecan Leaf Disease Severity

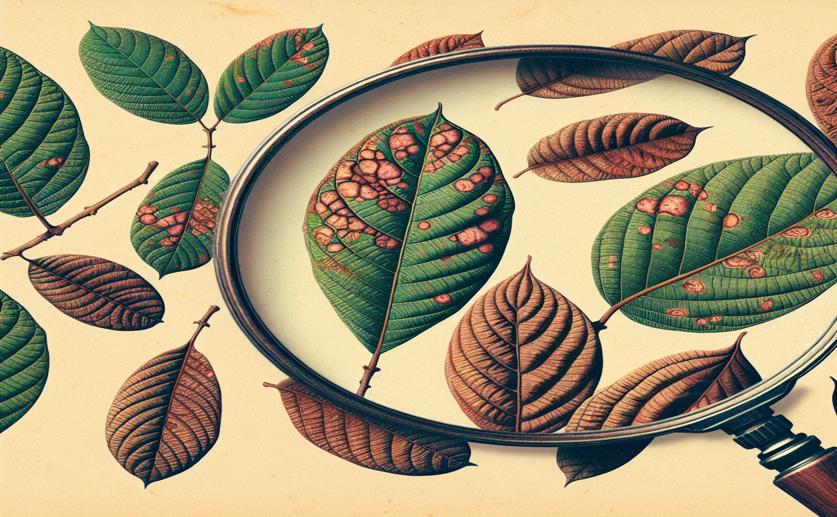
A true-color photographic image standard area diagram set for scab (Venturia effusa) severity on pecan (Carya illinoinensis) leaflets. The values underneath each leaflet represent the percent disease severity relative to the total area of the leaflet.

Image adapted from: Hilton et al. / CC0 1.0 (Source)
Pecan scab, caused by the fungus Venturia effusa, is a major threat to pecan production in the southeastern United States. Accurately assessing the severity of this disease is crucial for developing effective management strategies and understanding how different pecan varieties respond to the infection. However, visually estimating disease severity can be subjective, leading to inconsistencies between different observers. The USDA-ARS recently conducted a study[1] to address this issue by developing a standardized tool for evaluating pecan scab on leaflets – small diagrams showing varying degrees of disease severity. Historically, assessing plant diseases has relied on visual estimations, often using scales like the Horsfall-Barratt scale. However, research has shown that these methods can be prone to error, particularly when disease severity is moderate[2]. Estimations can vary significantly between individuals, and even the same individual may provide different assessments at different times. This variability can hinder research efforts and make it difficult to compare results across studies. One approach to improve accuracy has been to focus on measuring the incidence of disease – the proportion of plants or plant parts affected – rather than the severity – the extent of disease on those affected parts[3]. While incidence can be quicker to assess and potentially more reliable, severity remains important for understanding the overall impact of the disease. The study focused on creating a “standard area diagram” (SAD) set. Researchers harvested pecan leaflets with varying degrees of scab lesions and scanned them digitally. They then used image analysis software to precisely determine the actual percentage of leaf area affected by the disease, creating a reference point for comparison. These images, ranging from 0.2% to 48.9% disease severity, were then used to create the SADs. To test the effectiveness of the SADs, the researchers had 36 people assess the severity of both small and large leaflet images, first without the diagrams and then with them as a guide. They used statistical methods – Lin’s concordance correlation coefficient (LCC) and intraclass correlation coefficient (ICC) – to measure how well the raters’ estimates matched the actual disease severity and how consistent the ratings were between different raters. The results showed a significant improvement in both accuracy and reliability when the SADs were used. The LCC increased from 0.70 to 0.84, and the ICC increased from 0.54 to 0.82, demonstrating that the diagrams helped raters provide more accurate and consistent assessments. Interestingly, the study also found that the location of the raters and their level of experience influenced the results. Some raters benefited more from using the SADs than others, and there were significant differences in accuracy based on where the raters were located. Furthermore, raters were more accurate when assessing smaller leaflets compared to larger ones, suggesting that the size of the affected area can impact visual estimation – a concept known as psychophysics. This aligns with findings that visual assessments are more prone to error at moderate disease severities[2], as the wider grade intervals on scales like the Horsfall-Barratt scale can lead to greater discrepancies. The findings of this study build upon earlier work demonstrating the importance of standardized assessment methods in plant pathology[4]. By providing a visual reference, the SADs reduce the subjectivity inherent in visual estimations, leading to more reliable data. The development of these diagrams represents a practical tool for pecan researchers and growers, enabling more accurate monitoring of scab severity and more informed disease management decisions.

AgricultureBiotechPlant Science

References

Main Study

1) Standard area diagrams for pecan leaf scab: Effect of rater experience and location, and leaf size on reliability and accuracy of visual estimates.

Published 26th January, 2024

https://doi.org/10.1094/PDIS-09-23-1947-RE


Related Studies

2) Some consequences of using the Horsfall-Barratt scale for hypothesis testing.

https://doi.org/10.1094/PHYTO-08-09-0220


3) Disease Incidence-Severity Relationships on Leaflets, Leaves, and Fruit in the Pecan-Venturia effusa Pathosystem.

https://doi.org/10.1094/PDIS-11-18-1950-RE


4) Comparison of Assessment of Citrus Canker Foliar Symptoms by Experienced and Inexperienced Raters.

https://doi.org/10.1094/PDIS-93-4-0412


Related Articles

An unhandled error has occurred. Reload 🗙